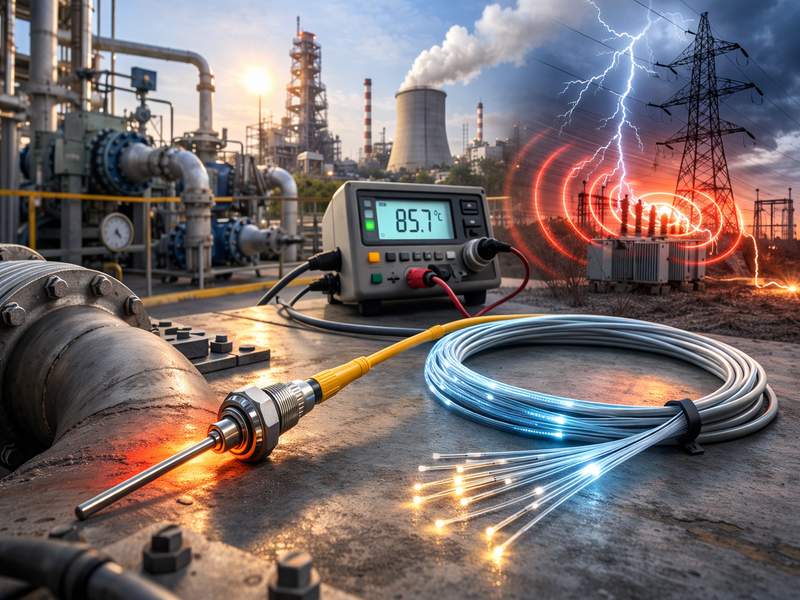
Benefits of Fiber Optic Temperature Sensors with EMI Immunity
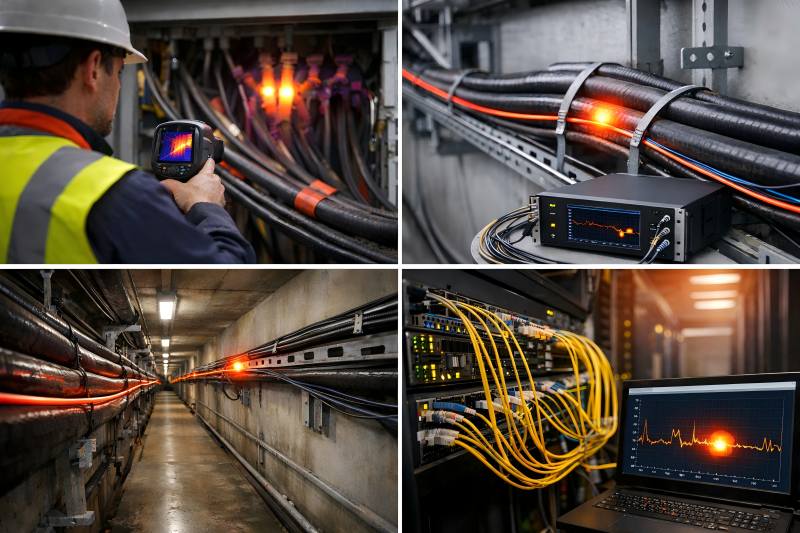
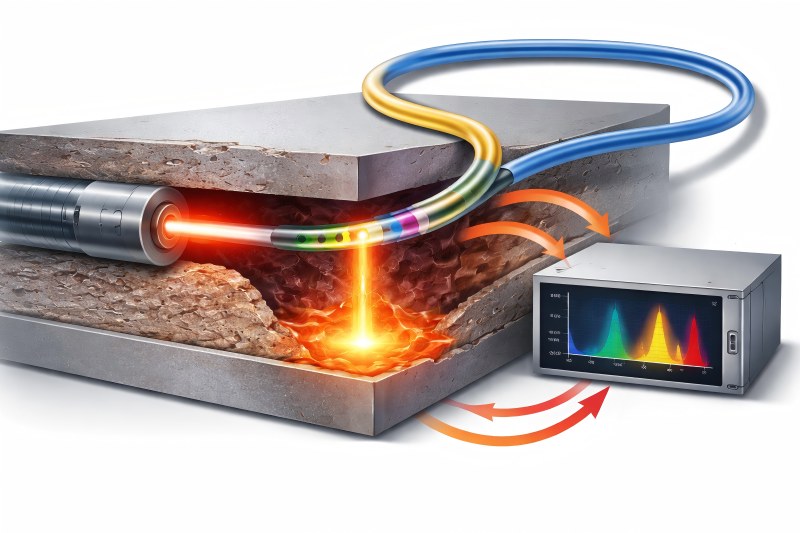
In modern industry, electromagnetic interference (EMI) from high-voltage equipment and machinery can disrupt traditional temperature sensors like thermocouples and RTDs. Fiber optic temperature sensors offer inherent EMI immunity, ensuring greater stability, safety, and reliability. As automation and digitalization advance, EMI resistance has become a key factor in sensor selection. Understanding EMI and Its Impact on Temperature Measurement Disturbances caused by external electromagnetic fields that impact electrical circuits are referred to as electromagnetic interference. In industrial settings, EMI can originate from: High-voltage transformers Switching power supplies Electric motors and drives Radio frequency transmitters Lightning strikes Power distribution systems Conventional temperature sensors rely on electrical signals transmitted through metallic conductors. These conductors act as antennas, picking up unwanted electromagnetic noise that distorts measurements. Consequences of EMI on Electrical Sensors EMI Effect Impact on Electrical Sensors Operational Risk Signal distortion Fluctuating readings Poor process control Noise interference Reduced accuracy False alarms Ground loops Measurement instability System faults Induced voltage spikes Sensor damage Equipment downtime Electromagnetic coupling Cross-signal contamination Data reliability loss In mission-critical environments such as substations, MRI rooms, aerospace systems, and industrial power plants, these issues can compromise safety and operational continuity. The Reasons Fiber Optic Sensors Are EMI-Insensitive Fiber optic temperature sensors transmit signals using light rather than electricity. The sensing mechanism is based on optical principles such as: Bragg wavelength shifts (Fiber Bragg Gratings) Raman backscattering (Distributed Temperature Sensing Fluorescence decay time Interferometric modulation Because optical fibers are made of dielectric materials (typically silica glass), they do not conduct electricity. They are unable to detect electromagnetic noise in the absence of electrical conductivity. Core Reasons for EMI Immunity No electrical current flows in the sensing element. Optical fibers are non-metallic and non-conductive. No susceptibility to induced voltage. Immune to radio frequency interference (RFI). No ground loops. This fundamental difference makes fiber optic temperature sensors uniquely suitable for high-EMI environments. Advantage 1: Stable and Accurate Measurements in High-Voltage Environments High-voltage installations such as power transformers, switchgear, and transmission systems generate intense electromagnetic fields. Traditional sensors often require shielding and complex grounding strategies to maintain signal integrity. Fiber optic sensors eliminate this requirement. Example: Transformer Hot Spot Monitoring Electrical sensors inside transformer windings are vulnerable to induced currents. Fiber optic sensors, however, can be embedded directly into the windings without interference. Parameter Electrical Sensor Fiber Optic Sensor EMI susceptibility High None Grounding requirements Complex Not required Signal stability Variable Stable Installation safety Moderate High Maintenance frequency Higher Lower By guaranteeing precise hotspot detection, this stability prolongs transformer life and averts catastrophic failures. Advantage 2: Enhanced Safety in Electrically Hazardous Areas In explosive or high-voltage environments, electrical sensors can pose safety risks. Even minimal electrical currents may produce sparks under fault conditions. Fiber optic sensors are intrinsically safe because: They carry no electrical power at sensing points. They do not generate sparks. They are immune to electromagnetic discharge. In sectors such as mining, chemical processing, and oil and gas, ensuring intrinsic safety is critical. Fiber optic technology aligns perfectly with stringent safety regulations. Advantage 3: Elimination of Ground Loop Problems Measurement mistakes result from ground loops, which happen when several grounding sites produce unauthorized current channels. Electrical sensors in large industrial installations often suffer from ground loop interference, especially over long cable runs. Fiber optic systems eliminate this issue entirely because: There is no electrical continuity between sensor and interrogator. Optical signals are immune to potential differences. No shared grounding path exists. This improves long-distance measurement reliability — particularly in distributed temperature sensing (DTS) applications spanning kilometers. Advantage 4: Radio Frequency Interference (RFI) immunity is the fourth benefit. Modern facilities include wireless communication systems, radar, RF heating systems, and high-frequency drives. These sources emit radio frequency interference that disrupts electronic sensors. The reason fiber optic sensors are unaffected is: Electromagnetic waves have no effect on light signals. No antenna effect occurs. Optical fibers do not radiate or receive RF signals. Fiber optic temperature sensors are therefore perfect for: Aerospace systems Military installations MRI rooms Semiconductor fabrication plants Advantage 5: Reliable Operation Near High-Power Equipment Heavy industrial environments often contain equipment such as: Induction furnaces Arc welders High-power inverters Large electric motors These generate strong transient electromagnetic pulses. Electrical sensors can experience temporary malfunction or permanent damage during voltage surges. Fiber optic systems remain unaffected by electromagnetic transients. Performance Comparison Under Transient EMI Condition Electrical Sensor Response Fiber Optic Sensor Response Voltage spike Possible damage No effect Switching transient Signal noise No disturbance Lightning surge Risk of failure Immune Magnetic flux variation Measurement drift Stable High-frequency switching Distorted readings Unaffected This reliability significantly reduces maintenance costs and downtime. Advantage 6: Long-Distance Signal Integrity In large-scale infrastructure such as tunnels, pipelines, and power cables, temperature sensing may require distances of several kilometers. Electrical signals degrade over long distances and require repeaters or signal conditioning. Fiber optic signals: Maintain signal integrity over long spans. Experience minimal attenuation. Do not accumulate electromagnetic noise. Distributed Temperature Sensing (DTS) systems can monitor temperature continuously over tens of kilometers without EMI interference. Advantage 7: Reduced Shielding and Installation Complexity To combat EMI, electrical systems require: Shielded cables Twisted pair wiring Conduit protection Grounding strategies Isolation amplifiers Fiber optic systems eliminate most of these requirements. Installation Comparison Feature Electrical System Fiber Optic System Shielded cable required Yes No Grounding network Complex Not required Isolation amplifier Often needed Not needed EMI filtering hardware Required Not required Installation cost Higher Lower long-term Although fiber optic interrogators may involve higher initial investment, reduced infrastructure complexity often balances overall lifecycle costs. Advantage 8: Improved Data Integrity for Digital Systems AI-driven monitoring, predictive maintenance, and data analytics are critical components of contemporary industrial processes. EMI-induced noise can compromise data reliability, affecting: Predictive models Alarm systems Safety monitoring Automated control loops Fiber optic temperature sensors provide clean, noise-free signals. High data fidelity is thus guaranteed, which is necessary for: Industrial IoT systems Smart grid applications Energy optimization platforms Advanced condition monitoring In digitally transformed facilities, data quality is as critical as measurement accuracy. Applications Where EMI Immunity Is