
Blogs

DTS vs FBG Fiber Optic Temperature Sensor
Blogs

DTS vs FBG Fiber Optic Temperature Sensor: Key Differences Explained

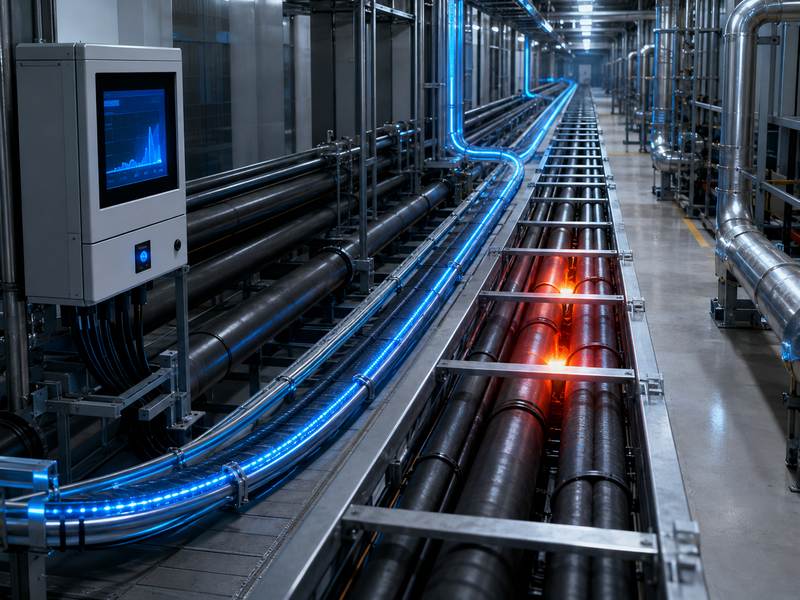
Fiber optic temperature sensors are used in power systems, tunnels, pipelines, industrial plants, energy storage, fire detection, and structural monitoring. They provide long-distance, high-sensitivity, and anti-interference temperature monitoring. A DTS Fiber Optic Temperature Sensor: What Is It? A fiber optic sensing system called Distributed Temperature Sensing, or DTS, continuously measures temperature throughout the length of an optical fiber. In a DTS system, the optical fiber itself functions as a sensing component. Instead of installing many individual point sensors, one fiber cable can monitor temperature changes across hundreds of meters or even several kilometers. Laser pulses are sent into the cable by the system. As the light travels through the fiber, part of it is scattered back to the monitoring device. By analyzing the backscattered optical signal, the system calculates temperature information along the fiber route. This allows the DTS system to provide a temperature profile of the whole monitored area. DTS is especially useful when the user needs continuous linear temperature monitoring. For example, in a power cable tunnel, DTS can monitor the temperature distribution along the full cable route. In a pipeline project, DTS can identify abnormal temperature changes along long-distance pipelines. In fire detection applications, DTS can detect hot spots before they develop into serious risks. Common DTS applications include: Power cable temperature monitoring Cable tunnel fire detection Oil and gas pipeline monitoring Conveyor belt fire detection Mine and tunnel safety monitoring Energy storage system temperature monitoring Industrial plant fire-risk monitoring District heating pipeline leakage detection The biggest advantage of DTS is that it provides distributed measurement. This means users can see temperature changes along the entire fiber, instead of only at selected points. An FBG Fiber Optic Temperature Sensor: What Is It? FBG, or Fiber Bragg Grating, is another fiber optic sensing technology. Unlike DTS, which measures temperature continuously along the fiber, FBG sensors measure temperature at specific points where gratings are written into the fiber. A tiny area inside an optical fiber that reflects a particular wavelength of light is called a fiber bragg grating. The reflected wavelength varies with temperature. By measuring this wavelength shift, the system can calculate the temperature at that specific grating location. In simple terms, an FBG temperature sensor works like a highly sensitive optical measuring point. Multiple FBG sensors can be written or connected along one fiber, allowing multi-point temperature monitoring. FBG sensors are often used when high accuracy, fast response, compact size, or precise point measurement is required. They are common in structural health monitoring, transformer temperature monitoring, battery temperature monitoring, composite material testing, aerospace engineering, and laboratory measurement. Common FBG applications include: Transformer winding temperature monitoring Battery module temperature monitoring Structural health monitoring Bridge and tunnel monitoring Aerospace and composite material testing Industrial equipment temperature measurement High-voltage equipment monitoring Medical and research applications The biggest advantage of FBG is precise point measurement. It works well in situations where the user is aware of the precise location where the temperature should be recorded. DTS vs FBG: Basic Comparison Although both DTS and FBG use optical fiber, they are designed for different monitoring needs. DTS focuses on long-distance distributed measurement, while FBG focuses on precise point or multi-point measurement. Item DTS Fiber Optic Temperature Sensor FBG Fiber Optic Temperature Sensor Full name Distributed Temperature Sensing Fiber Bragg Grating Measurement type Continuous distributed measurement Point or multi-point measurement Sensing element Entire optical fiber Specific grating points Monitoring distance Suitable for long distances Suitable for selected measuring points Data output Temperature profile along the fiber Temperature data at each FBG point Typical use Cable tunnels, pipelines, and fire detection Transformers, batteries, structures, equipment Main advantage Large-area continuous monitoring High precision at defined points System design focus Route coverage and zone division Sensor placement and point accuracy This comparison shows that DTS and FBG should not always be seen as competitors. In many projects, they solve different problems. Working Principle Difference The key difference between DTS and FBG starts with their sensing principle. DTS works by analyzing backscattered light along the fiber. Since the system can calculate where the backscattered signal comes from, it can identify temperature changes at different positions along the fiber. The optical fiber acts like a continuous temperature sensor. FBG works by analyzing the wavelength shift from grating points. Each FBG sensor reflects a specific wavelength. When temperature changes, the grating expands or contracts slightly, causing the reflected wavelength to shift. The monitoring device converts that wavelength shift into temperature data. Technical Aspect DTS FBG Optical principle Backscattering analysis Wavelength reflection shift Measurement location Along the whole fiber At grating positions Temperature calculation Based on the scattered light signal Based on the Bragg wavelength shift Data density Continuous or near-continuous Depends on the number of FBG points Sensor structure Standard or special sensing fiber cable Fiber with written grating sensors Positioning method Based on optical time/location calculation Based on known sensor positions In practical terms, DTS is better when users need to know where along a long route a temperature change occurs. FBG is better when users need to measure specific key points with high accuracy. 5. Monitoring Range and Distance Monitoring distance is one of the most important differences between DTS and FBG. DTS systems are designed for long-distance monitoring. Depending on system configuration and fiber type, DTS can monitor hundreds of meters to many kilometers. This makes it suitable for linear assets such as power cables, tunnels, pipelines, and conveyor belts. FBG systems can also support multiple sensors over one fiber, but the number of points and distance depend on the interrogator, wavelength range, sensor spacing, and system design. FBG is usually more suitable for defined measuring locations rather than continuous long-distance coverage. Monitoring Requirement Better Choice Reason Several kilometers of cable route DTS Continuous monitoring along the full route Pipeline temperature profile DTS Detects distributed temperature changes Transformer internal hot spot FBG Measures selected critical points accurately Battery module temperature points FBG Compact sensors can be placed at key locations Tunnel fire detection line DTS Monitors long linear fire-risk areas

Reduce False Alarms in Fiber Optic Temperature Monitoring
Blogs

How to Reduce False Alarms in Fiber Optic Temperature Monitoring

Fiber optic temperature monitoring is used in cables, tunnels, pipelines, energy facilities, industrial plants, data centers, and fire-risk areas for continuous temperature detection and early overheating warnings. However, false alarms can reduce trust, increase inspection costs, and disrupt operations. Reducing them requires proper design, installation, signal processing, environmental compensation, smart alarm logic, and regular maintenance. Understanding False Alarms in Fiber Optic Temperature Monitoring Fiber optic temperature monitoring systems usually use optical fibers as sensing elements. The system detects temperature changes by analyzing optical signals along the fiber. In distributed temperature sensing, one fiber cable can monitor thousands of temperature points over long distances. This makes it highly suitable for large-scale assets such as cable tunnels, oil pipelines, conveyor belts, transformer areas, and industrial storage zones. False alarms can happen when the system misinterprets normal temperature fluctuation, installation stress, signal noise, or environmental interference as a real abnormal condition. Common false alarm situations include: Alarm triggered by a short-term temperature fluctuation Alarm caused by poor fiber cable installation Alarm from mechanical stress or fiber bending Alarm caused by incorrect zone configuration Alarm triggered by background heat sources Alarm caused by unstable system calibration Alarm from communication or data processing errors To reduce false alarms, the system should be treated as a complete solution, not only a sensing device. Main Causes of False Alarms Before improving alarm accuracy, it is important to understand where false alarms come from. In many projects, false alarms are not caused by the fiber optic technology itself, but by poor design, poor installation, or unsuitable alarm settings. Cause of False Alarm Typical Scenario Impact on Monitoring Accuracy Improper alarm threshold The fixed temperature limit is too low Normal temperature rise may trigger alarms Poor cable installation Fiber cable is bent, squeezed, or loosely fixed Signal distortion or unstable readings Environmental heat sources Sunlight, hot pipes, machines, and ventilation outlets Localized heat may be misjudged as a danger Signal noise Weak optical signal or poor connector quality Unstable temperature data Incorrect zone division One alarm zone covers different environments Hard to identify real abnormal conditions Lack of trend analysis The system reacts to instant temperature peaks Short-term changes become alarms Insufficient maintenance Dirty connectors, aging cables, loose joints Long-term system reliability decreases Understanding these causes helps engineers choose the right technical measures during design, installation, and operation. Use Dynamic Alarm Thresholds Instead of Fixed Limits One of the most effective ways to reduce false alarms is to avoid relying only on fixed temperature thresholds. A fixed threshold means the alarm is triggered when the temperature exceeds a preset value, such as 60°C or 80°C. This method is simple, but it may not work well in complex environments. For example, the normal temperature of a power cable in summer may be much higher than in winter. A tunnel section close to ventilation equipment may have a different background temperature from an underground section. If the same fixed threshold is applied to all areas, false alarms may increase. A better method is to use dynamic alarm thresholds. These thresholds consider background temperature, historical data, equipment operating conditions, and temperature change rate. Alarm Method Description False Alarm Risk Best Use Case Fixed temperature threshold Alarm triggers when the temperature exceeds a set value Medium to high Simple environments Differential temperature alarm Compares the temperature difference between nearby points Lower Cable tunnels, pipelines, and long-distance routes Rate-of-rise alarm Detects how fast the temperature increases Lower Fire-risk areas, overheating detection Dynamic baseline alarm Compares current data with the historical normal range Low Complex industrial environments Multi-condition alarm An alarm requires several conditions to be met Very low High-security or high-value assets Dynamic alarm logic can identify abnormal changes more accurately because it focuses on the temperature behavior, not only the absolute temperature value. For example, a temperature of 55°C may be normal for a heavily loaded power cable, but dangerous for a storage area. Similarly, a temperature rise from 30°C to 50°C within two minutes may be more dangerous than a stable temperature of 55°C over several hours. Apply Temperature Trend Analysis False alarms often happen when the system reacts too quickly to temporary temperature changes. In many real applications, short-term temperature spikes may be caused by sunlight exposure, temporary equipment operation, hot air movement, or brief load changes. Temperature trend analysis helps the system distinguish between temporary fluctuation and real abnormal development. A reliable system should analyze: Current temperature Historical temperature Temperature rise speed Temperature duration Temperature difference between adjacent points Repeated abnormal patterns For example, if the temperature rises sharply and continues increasing, it may indicate overheating or fire risk. However, it can be a transient situation if the temperature raises momentarily before returning to normal. Temperature Pattern Possible Meaning Recommended Alarm Response Sudden short spike Temporary heat source or signal fluctuation Record event, delay alarm Slow continuous rise Equipment load increase or developing fault Warning alarm Fast continuous rise Fire risk or serious overheating High-priority alarm Local hot spot with stable surroundings Real localized abnormal heating Zone alarm and inspection Similar rise across a large area Environmental temperature change Adjust baseline or issue a low-level alert The technique can cut down on pointless alerts while still identifying actual threats early by examining temperature changes. Improve Fiber Cable Installation Quality Installation quality directly affects monitoring stability. Even the best fiber optic temperature monitoring system may produce false alarms if the sensing cable is installed incorrectly. Poor installation can create mechanical stress, bending loss, weak signal points, or unstable contact with the monitored object. For example, if a sensing cable is installed too loosely on a power cable, the measured temperature may not accurately reflect the cable surface temperature. If the cable is squeezed or bent sharply, the optical signal quality may degrade. Good installation practices include: Avoid excessive bending and twisting of the fiber cable Keep the bending radius within the manufacturer’s recommendations Use proper fixing accessories instead of sharp metal fasteners Ensure stable contact between the sensing cable and

Benefits of Fiber Optic Temperature Sensors with EMI Immunity
Blogs

Benefits of Fiber Optic Temperature Sensors with EMI Immunity

In modern industry, electromagnetic interference (EMI) from high-voltage equipment and machinery can disrupt traditional temperature sensors like thermocouples and RTDs. Fiber optic temperature sensors offer inherent EMI immunity, ensuring greater stability, safety, and reliability. As automation and digitalization advance, EMI resistance has become a key factor in sensor selection. Understanding EMI and Its Impact on Temperature Measurement Disturbances caused by external electromagnetic fields that impact electrical circuits are referred to as electromagnetic interference. In industrial settings, EMI can originate from: High-voltage transformers Switching power supplies Electric motors and drives Radio frequency transmitters Lightning strikes Power distribution systems Conventional temperature sensors rely on electrical signals transmitted through metallic conductors. These conductors act as antennas, picking up unwanted electromagnetic noise that distorts measurements. Consequences of EMI on Electrical Sensors EMI Effect Impact on Electrical Sensors Operational Risk Signal distortion Fluctuating readings Poor process control Noise interference Reduced accuracy False alarms Ground loops Measurement instability System faults Induced voltage spikes Sensor damage Equipment downtime Electromagnetic coupling Cross-signal contamination Data reliability loss In mission-critical environments such as substations, MRI rooms, aerospace systems, and industrial power plants, these issues can compromise safety and operational continuity. The Reasons Fiber Optic Sensors Are EMI-Insensitive Fiber optic temperature sensors transmit signals using light rather than electricity. The sensing mechanism is based on optical principles such as: Bragg wavelength shifts (Fiber Bragg Gratings) Raman backscattering (Distributed Temperature Sensing Fluorescence decay time Interferometric modulation Because optical fibers are made of dielectric materials (typically silica glass), they do not conduct electricity. They are unable to detect electromagnetic noise in the absence of electrical conductivity. Core Reasons for EMI Immunity No electrical current flows in the sensing element. Optical fibers are non-metallic and non-conductive. No susceptibility to induced voltage. Immune to radio frequency interference (RFI). No ground loops. This fundamental difference makes fiber optic temperature sensors uniquely suitable for high-EMI environments. Advantage 1: Stable and Accurate Measurements in High-Voltage Environments High-voltage installations such as power transformers, switchgear, and transmission systems generate intense electromagnetic fields. Traditional sensors often require shielding and complex grounding strategies to maintain signal integrity. Fiber optic sensors eliminate this requirement. Example: Transformer Hot Spot Monitoring Electrical sensors inside transformer windings are vulnerable to induced currents. Fiber optic sensors, however, can be embedded directly into the windings without interference. Parameter Electrical Sensor Fiber Optic Sensor EMI susceptibility High None Grounding requirements Complex Not required Signal stability Variable Stable Installation safety Moderate High Maintenance frequency Higher Lower By guaranteeing precise hotspot detection, this stability prolongs transformer life and averts catastrophic failures. Advantage 2: Enhanced Safety in Electrically Hazardous Areas In explosive or high-voltage environments, electrical sensors can pose safety risks. Even minimal electrical currents may produce sparks under fault conditions. Fiber optic sensors are intrinsically safe because: They carry no electrical power at sensing points. They do not generate sparks. They are immune to electromagnetic discharge. In sectors such as mining, chemical processing, and oil and gas, ensuring intrinsic safety is critical. Fiber optic technology aligns perfectly with stringent safety regulations. Advantage 3: Elimination of Ground Loop Problems Measurement mistakes result from ground loops, which happen when several grounding sites produce unauthorized current channels. Electrical sensors in large industrial installations often suffer from ground loop interference, especially over long cable runs. Fiber optic systems eliminate this issue entirely because: There is no electrical continuity between sensor and interrogator. Optical signals are immune to potential differences. No shared grounding path exists. This improves long-distance measurement reliability — particularly in distributed temperature sensing (DTS) applications spanning kilometers. Advantage 4: Radio Frequency Interference (RFI) immunity is the fourth benefit. Modern facilities include wireless communication systems, radar, RF heating systems, and high-frequency drives. These sources emit radio frequency interference that disrupts electronic sensors. The reason fiber optic sensors are unaffected is: Electromagnetic waves have no effect on light signals. No antenna effect occurs. Optical fibers do not radiate or receive RF signals. Fiber optic temperature sensors are therefore perfect for: Aerospace systems Military installations MRI rooms Semiconductor fabrication plants Advantage 5: Reliable Operation Near High-Power Equipment Heavy industrial environments often contain equipment such as: Induction furnaces Arc welders High-power inverters Large electric motors These generate strong transient electromagnetic pulses. Electrical sensors can experience temporary malfunction or permanent damage during voltage surges. Fiber optic systems remain unaffected by electromagnetic transients. Performance Comparison Under Transient EMI Condition Electrical Sensor Response Fiber Optic Sensor Response Voltage spike Possible damage No effect Switching transient Signal noise No disturbance Lightning surge Risk of failure Immune Magnetic flux variation Measurement drift Stable High-frequency switching Distorted readings Unaffected This reliability significantly reduces maintenance costs and downtime. Advantage 6: Long-Distance Signal Integrity In large-scale infrastructure such as tunnels, pipelines, and power cables, temperature sensing may require distances of several kilometers. Electrical signals degrade over long distances and require repeaters or signal conditioning. Fiber optic signals: Maintain signal integrity over long spans. Experience minimal attenuation. Do not accumulate electromagnetic noise. Distributed Temperature Sensing (DTS) systems can monitor temperature continuously over tens of kilometers without EMI interference. Advantage 7: Reduced Shielding and Installation Complexity To combat EMI, electrical systems require: Shielded cables Twisted pair wiring Conduit protection Grounding strategies Isolation amplifiers Fiber optic systems eliminate most of these requirements. Installation Comparison Feature Electrical System Fiber Optic System Shielded cable required Yes No Grounding network Complex Not required Isolation amplifier Often needed Not needed EMI filtering hardware Required Not required Installation cost Higher Lower long-term Although fiber optic interrogators may involve higher initial investment, reduced infrastructure complexity often balances overall lifecycle costs. Advantage 8: Improved Data Integrity for Digital Systems AI-driven monitoring, predictive maintenance, and data analytics are critical components of contemporary industrial processes. EMI-induced noise can compromise data reliability, affecting: Predictive models Alarm systems Safety monitoring Automated control loops Fiber optic temperature sensors provide clean, noise-free signals. High data fidelity is thus guaranteed, which is necessary for: Industrial IoT systems Smart grid applications Energy optimization platforms Advanced condition monitoring In digitally transformed facilities, data quality is as critical as measurement accuracy. Applications Where EMI Immunity Is

7 Reasons Industries Are Switching to Distributed Temperature Sensing
Blogs

7 Reasons Industries Are Switching to Distributed Temperature Sensing (DTS)

Accurate, real-time temperature monitoring is now essential in modern industry. Across the petrochemical, energy, manufacturing, and infrastructure sectors, Distributed Temperature Sensing (DTS) provides continuous, fiber-based measurements that outperform traditional point sensors. Real-Time, Continuous Monitoring Across Large Areas Traditional temperature sensors like thermocouples and RTDs measure temperature at discrete points. While adequate for small or localized systems, these sensors fail to capture temperature gradients across large installations — such as pipelines, storage tanks, and electrical assets. Distributed Temperature Sensing changes this paradigm. Using optical fibers as continuous sensing elements, DTS systems provide thermal measurements every meter (or even less) along the length of the fiber. This means industries can now monitor entire segments of infrastructure simultaneously — in real time. Benefits of Continuous Monitoring Immediate detection of thermal anomalies — Allowing for faster response to equipment failures or safety hazards. Elimination of blind spots — No gap between sensors means no undetected hot spots. Better process optimization — Enables finer control over temperature-dependent processes. For industries such as oil and gas, power transmission, and chemical manufacturing — where hundreds of meters of equipment operate under extreme temperatures — this level of insight is invaluable. Enhanced Safety in Hazardous Environments Safety remains a paramount concern across industrial applications. Temperature anomalies often serve as early warning signs for mechanical failures, chemical runaway reactions, or thermal stress in equipment. Failures in monitoring can lead to unplanned shutdowns, fires, or catastrophic failures. DTS systems minimize these risks: Explosion-proof fiber optics — Because the sensing element is passive, it does not create electrical sparks, making DTS suitable for hazardous environments such as offshore platforms and petrochemical plants. Real-time thermal profiles — Maintenance teams can detect dangerous hotspots early and intervene before escalation. Reduced need for human intervention — Lowering the risk for personnel operating in risky environments. In sectors dealing with combustible gases or high heat processes, the ability to continuously monitor and react to temperature changes is a critical component of operational safety. High Accuracy and Spatial Resolution Accuracy and resolution are two critical metrics in any temperature measurement system. While conventional sensors provide accurate point measurements, they offer no information between sensor points. DTS systems deliver: High spatial resolution — Some systems can measure temperature changes over intervals as close as 0.1 to 1 meter. Precise thermal mapping — Allowing operators to distinguish subtle temperature variations across broad areas. This capability is especially significant in applications such as: Pipeline integrity monitoring Transformer winding temperature profiling Industrial furnace and kiln process control By achieving fine-grained thermal data with minimal instrumentation, DTS enables proactive decision-making based on detailed temperature maps rather than isolated data points. Cost Savings Through Reduced Downtime and Maintenance Unplanned downtime is one of the most costly burdens in industry. Unexpected thermal failures can halt production lines, damage equipment, or incur safety fines and regulatory penalties. DTS provides cost savings by: A. Predictive Maintenance Many failures begin as subtle temperature changes long before they become visible or catastrophic. Because DTS sees these patterns early, maintenance crews may take action before problems arise. Predictive maintenance reduces: Equipment wear and tear Emergency repairs Replacement costs B. Reduced Labor Costs Instead of installing hundreds of discrete sensors and performing scheduled manual inspections, industries can monitor entire systems remotely using a single fiber optic sensing network. C. Extended Asset Lifespan By avoiding thermal stress and controlled temperature escalation, equipment life expectancy improves — resulting in further long-term savings. Studies have shown that predictive temperature monitoring with DTS can cut downtime costs by millions annually for large industrial operations. Ease of Installation and Flexibility When compared to traditional temperature sensors, DTS offers significant advantages in installation and scalability. Simple Installations Optical fibers are: Lightweight Low profile Easy to route along pipes, walls, cables, or conduits Unlike electrical sensors where wiring complexity increases with each sensor added, DTS requires only one fiber network with no additional power at sensing points. This reduces: Installation time Conduit and wiring costs Need for junction boxes or auxiliary power Scalable and Future-Ready Adding more coverage or extending the sensing range is as simple as deploying additional fiber — often without significant infrastructure changes. Industries with expanding assets therefore find DTS to be both a short-term solution and a future-proof monitoring platform. Multi-Industry and Multi-Application Versatility The appeal of Distributed Temperature Sensing extends far beyond a single industry. Because the technology measures temperature over distances — and not just at pre-selected points — applications are remarkably broad. Here are some of the major use cases: Oil & Gas Pipeline leak detection Flow monitoring in multiphase pipelines Offshore platform safety monitoring Power / Energy Transformer temperature profiling Power cable thermal monitoring Substation asset protection Industrial Manufacturing Furnace process control Heat exchanger monitoring Chemical reactor thermal profiling Infrastructure & Civil Engineering Fire detection in tunnels Structural monitoring in bridges and buildings Geothermal temperature analysis This versatility is one of the primary reasons industries with complex thermal challenges — spanning energy, infrastructure, and manufacturing — are making the switch to DTS. Integration with Analytics and Digital Infrastructure Modern industrial ecosystems are increasingly adopting digital transformation initiatives — think Industrial Internet of Things (IIoT), predictive analytics, and AI-based process optimization. DTS fits seamlessly within these frameworks. Data-Driven Decision Support By generating rich streams of temperature data over time, DTS systems can integrate with: AI models for anomaly detection Cloud-based analytic platforms Energy efficiency dashboards This opens new possibilities: Enhanced process control Automated alarms and alerting Trend forecasting for maintenance planning Rather than standalone sensors feeding isolated data, DTS becomes a critical source of continuous, actionable insights within an enterprise’s digital infrastructure. Case Illustration: Oil Pipeline Monitoring with DTS Consider the challenges faced by cross-country oil pipeline operators Long distances spanning hundreds of kilometers Extreme ambient temperatures Risk of external interference, leaks, or blockages Traditional sensors can only monitor discrete points — leaving large blind zones between measurement locations. DTS, using a single optical fiber line, can detect temperature changes continuously over the entire pipeline segment. Temperature anomalies can indicate: Flow interruptions Leak locations Freeze points in colder climates With real-time

Using Fiber Optic Temperature Systems to Prevent Cable Fires
Blogs

Using Fiber Optic Temperature Systems to Prevent Cable Fires

Electrical cables power critical systems in data centers, plants, substations, and transport hubs, often under heavy loads. As energy demands rise, overheating has become a major fire risk, leading to outages, damage, compliance issues, and safety hazards. Traditional methods like thermal scans and point sensors often miss early hotspots and lack continuous monitoring. Fiber optic temperature systems provide real-time, continuous detection along the entire cable, enabling early fire prevention. Why Cable Fires Occur Electrical cables can overheat for many reasons. Understanding these causes is essential to appreciating why advanced monitoring is necessary. Common Causes of Cable Overheating Overloading: Current beyond cable design capacity raises conductor temperature. Loose connections: Poor terminations create resistance, generating heat. Insulation degradation: Aging or damaged insulation increases leakage and heat. Ambient conditions: High local temperature or poor ventilation reduces heat dissipation. Mechanical damage: Crush or impact reduces thermal performance. Faults: Arcing and short circuits produce localized hotspots. Uncontrolled heat can degrade insulation and conductor integrity, leading to short circuits, combustible arcing, or ignition of surrounding materials — all precursors to cable fires. Traditional Overheating Detection Methods and Their Limits Before reviewing fiber optic temperature systems, it’s useful to understand standard methods and why they fall short in preventing cable fires. Method How It Works Limitations Manual Thermography Periodic thermal imaging scans by technicians Only as good as inspection frequency; misses transient events; labor-intensive Point Temperature Sensors Fixed RTDs or thermocouples at select points Doesn’t cover the entire cable length; hotspots between sensors go undetected Current Monitoring Detects overcurrent conditions via ammeters Only infers temperature; may not detect resistive heating or insulation failure Visual Inspection The technician looks for signs of damage Reactive, not continuous; misses hidden or early-stage thermal issues Smoke/Flame Detectors Standard fire alarm systems Only detects fire after combustion has started; too late for prevention Because these technologies either monitor indirectly, are intermittent, or have low spatial coverage, a gap remains in early, continuous, and accurate temperature monitoring of cable systems. That gap is exactly what fiber optic temperature monitoring fills. How Fiber Optic Temperature Monitoring Works Fiber optic temperature systems leverage the physical properties of optical fibers (typically using backscatter phenomena such as Raman or Brillouin scattering) to measure temperature along the length of a fiber cable. Principles of Operation An optical fiber is laid alongside or integrated into the power/data cable infrastructure. A central interrogator unit sends laser pulses down the fiber. As the light travels, some of it backscatters due to inherent microscopic irregularities in the fiber. Temperature affects the backscattered signal’s properties. By examining these modifications, the system is able to: Check the temperature at each location along the fiber. Identify precise locations of hotspots Generate continuous, real-time temperature profiles This process is typically referred to as Distributed Temperature Sensing (DTS). Types of Fiber Optic Temperature Systems System Type Description Typical Accuracy Raman-based DTS Uses Raman backscatter to measure temperature ±1°C to ±2°C Brillouin-based DTS Uses Brillouin scattering for temperature and strain ±0.5°C to ±1.5°C Fiber Bragg Grating (FBG) Uses embedded gratings for precise point measurements ±0.1°C Depending on the necessary spatial resolution, measurement range, and cost, each strategy has a place. Why Fiber Optic Systems Are Ideal for Cable Fire Prevention Fiber optic temperature systems substantially mitigate several shortcomings of traditional methods. Below are key benefits: Continuous, Real-Time Monitoring Unlike periodic surveys, fiber optic systems provide instant temperature data. Temperature rise trends are detected early, offering time to respond before conditions worsen. Distributed Detection Along Entire Cable Length Where traditional point sensors monitor a handful of locations, fiber optics monitor every meter (or even centimeter) of cable — from meter zero to kilometer marks. Early Warning of Hotspots Localized overheating due to loose connections or insulation failure can be identified well before insulation breakdown or combustible conditions occur. Non-Conductive and Immune to Electromagnetic Interference Optical fibers are dielectric and not affected by electrical noise. They are safe to install near high voltage cables. Integration with Automated Protection Systems Fiber optic systems can be tied into SCADA, BMS (Building Management Systems), or industrial PLCs — triggering alarms, automated shutdowns, or cooling responses. Scalability Whether a small data room or a long high-voltage feeder tunnel, the same technology scales from tens of meters to tens of kilometers. Key Applications of Fiber Optic Temperature Monitoring The following sectors benefit significantly from fiber optic temperature systems: Electrical Distribution and Substations High current feeders, switchgear connection cables, and transformer bushings are common hotspots in substations. DTS systems can pinpoint heaters before faults occur. Tunnel and Infrastructure Power Cables Transport tunnels often bundle power cables without easy access for inspection. Continuous temperature monitoring ensures safety in environments where manual access is limited. Data Centers and IT Infrastructure Data center power distribution and UPS cabling must remain within thermal design limits. Early overheating detection prevents outages and fire risk. Industrial Plants Manufacturing environments with high ambient temperatures and heavy machinery loading require robust monitoring of critical power cables. Renewable Energy Systems Wind farms, solar installations, and battery storage sites often have remote or distributed cable networks that benefit from centralized temperature monitoring. Implementing Fiber Optic Temperature Monitoring for Cable Safety To make the most of fiber optic systems, proper planning and integration are essential. Consider these key steps. Cable and Fiber Installation Best Practices Place the fiber as close as possible to the cable surface to ensure accurate temperature measurement. Use protective conduits or clips designed for cable trays and duct banks. Avoid sharp bends; maintain minimum bend radius specifications of the optical fiber. In high-temperature zones, consider fire-rated fiber jackets. System Configuration and Calibration Define alarm thresholds based on cable specification and environmental conditions. Calibrate the system with baseline measurements when cables are at known temperatures. Configure multi-zone monitoring for complex cable layouts. Integration with Control Systems Connect fiber optic alarms to Building Management Systems (BMS), SCADA, or industrial PLCs. Implement automated responses like fan activation, load shedding, or emergency shutdowns upon threshold breach. Leverage data logging for trend analysis and predictive maintenance. Maintenance and Testing Perform routine integrity checks of fiber continuity. Validate alarm

Fiber Optic Temperature Sensors in Airport Runways
Blogs

Fiber Optic Temperature Sensors in Airport Runways

Airport runways face extreme loads and environmental stress, making accurate temperature monitoring essential for safety and performance. This article explores how fiber optic temperature sensing enables reliable, high-resolution runway monitoring and its advantages over traditional methods. Why Temperature Monitoring Matters for Airport Runways Runway integrity and performance depend heavily on temperature-dependent physical processes. Elevated or fluctuating temperatures can: Accelerate pavement degradation: Asphalt layers soften at high temperatures, while thermal contraction at low temperatures can lead to cracking and surface irregularities. Alter load-bearing characteristics: Subsurface temperature changes impact stiffness and modulus of pavement materials, affecting load distribution. Influence maintenance and safety operations: Real-time temperature data can inform decisions about runway usage, de-icing operations, and aircraft braking performance. Listening only to discrete thermocouples or surface probes has limitations in coverage and granularity. Runways, especially long ones exceeding a mile in length, benefit from continuous, distributed temperature data rather than isolated point measurements. How Fiber Optic Temperature Sensing Works A fiber optic temperature sensor uses optical fibers as the sensing medium, replacing traditional electrical sensors. Light pulses transmitted through an optical fiber experience changes due to temperature variations along the fiber. These changes are then detected and interpreted by a dedicated interrogation system to produce a temperature profile. Core Principles There are two major distributed sensing approaches used for temperature monitoring in infrastructures like airport runways: Distributed Temperature Sensing (DTS) In this method, the optical fiber itself acts as a continuous sensor covering long distances. Light is sent through the fiber and the fraction of backscattered light — typically based on Raman scattering — is analyzed to determine local temperature along the fiber’s length. Spatial resolution scales from meters to dozens of kilometers depending on system configuration. Fiber Bragg Grating (FBG) Sensors FBGs are inscribed along the fiber at specific intervals. They reflect particular wavelengths of light, and shifts in the reflected wavelength correspond to temperature changes at precise locations. This allows discrete multipoint temperature sensing with high precision. Key Advantages of Fiber Optic Sensors: Feature Benefit Distributed measurement Continuous temperature data along kilometers of runway High spatial resolution Detect small thermal anomalies or gradients EMI immunity Not affected by electromagnetic interference Durability and flexibility Withstand harsh environmental conditions Non-conductive and safe Ideal for critical infrastructure Installing Fiber Optic Sensors in Runways Integrating fiber optic temperature sensing in runway systems involves embedding or laying fiber optic cables within and beneath the pavement layers. These installations can be configured as: Subsurface installations: Fiber routes run within the base and sub-base layers of runways to capture temperature variations affecting structural components. Surface or near-surface configurations: Suitable for monitoring surface thermal gradients that influence friction and material performance. The placement design depends on specific monitoring objectives — such as detecting hotspots (zones of excessive heat), monitoring freeze-thaw effects, or managing thermal effects from aircraft landing cycles. Typical Fiber Deployment Zones and Monitoring Goals Deployment Zone Monitoring Objective Examples of Insights Runway surface layers Surface temperature mapping Detect high heat zones; friction performance correlation Base and sub-base Subsurface thermal behavior Detect thermal gradients affecting pavement stiffness Adjacent taxiways Cross-infrastructure thermal linkage Early warning for edge cracking Complete runway length DTS Continuous profile Identify systemic thermal trends Technical Considerations for Runway Applications Fiber optic sensors have several technical characteristics that make them ideal for runway monitoring, but they also require careful system design and calibration. Resolution & Accuracy Distributed fiber optic systems can achieve meter-level spatial resolution and temperature resolution within ±1°C or better, allowing detailed thermal characterization of multiple runway zones. Calibration Challenges Accurate runway temperature sensing requires careful calibration to differentiate between true thermal changes and factors like fiber strain or installation stresses. Calibration routines often involve reference temperature sources and baseline profiling. Environmental Robustness Optical fibers — typically made of glass — are inherently resistant to corrosion, chemical attack, and electromagnetic fields. This makes them suitable for the harsh airport environment, where electrical sensors can suffer from EMI and corrosion. Comparing Fiber Optic Sensors to Traditional Methods To understand the transformative value of fiber optic sensors in airport runway monitoring, it’s helpful to compare them with conventional technologies like thermocouples or infrared surface scanners. Fiber Optic vs Traditional Temperature Sensors Metric Traditional Sensors (Thermocouples) Fiber Optic Sensors Measurement type Point-based Distributed profile Installation complexity Moderate Moderate-high initial setup Spatial coverage Limited Full runway length Maintenance Requires regular checks Robust long-term sensor integrity EMI susceptibility High None Environmental durability Susceptible Highly resistant Data richness Low Very high Summary: While traditional sensors remain valuable for localized temperature measurements, they struggle to deliver a complete picture along long, complex infrastructures like airport runways. Fiber optics provides continuous data streams that help engineers and airport operators make better maintenance and safety decisions. Use Cases and Real-World Examples Structural Health Monitoring Distributed fiber optic temperature sensors create a thermal “map” of runway conditions. By correlating temperature variations with structural responses and stress patterns, engineers can anticipate pavement distress before visible damage occurs. Operational Safety Temperature data helps airports manage operations, especially in extreme weather. For instance: Hot weather runway maintenance: Detect surface softening to schedule early maintenance. Cold weather operations: Identify subsurface freeze zones that affect braking performance. Data-Driven Predictive Maintenance Continuous temperature monitoring supports predictive models that forecast wear and failure, enabling targeted maintenance planning that extends runway life and reduces unplanned closures. Smart Runway Integration Airport digital runway concepts use fiber optic sensors alongside other IoT technologies to create an intelligent monitoring system. This aligns with research into “smart runways” that integrate multi-sensor data for real-time performance assessment. Benefits of Fiber Optic Temperature Monitoring in Airports Using fiber optic sensors in runway monitoring brings several operational, safety, and financial advantages: Enhanced Safety Continuous real-time temperature data lets airport authorities react quickly to thermal anomalies that may affect runway friction, pavement integrity, or load-bearing capacity. Lower Long-Term Costs Although initial installation may be costlier than traditional sensors, fiber optic systems reduce long-term maintenance expenses by providing early warnings that prevent major repairs. Scalability Fiber networks can be extended or upgraded with new sensing modalities

E3 Distributed Temperature Sensing
Blogs

Long-Term Reliability Testing of Fiber Optic Temperature Systems

Fiber optic temperature sensing systems are valued for EMI immunity and long-distance monitoring, but long-term reliability is critical. This article examines why reliability testing matters and how it ensures stable performance over time. Why Long-Term Reliability Matters Fiber optic temperature systems are frequently deployed in critical and inaccessible environments, such as: High-voltage substations Underground tunnels and pipelines Nuclear and thermal power plants Offshore platforms Rail and metro infrastructure In these applications, sensor failure can lead to undetected overheating, false alarms, or costly shutdowns. Unlike conventional electrical sensors that may be replaced periodically, fiber optic systems are often embedded permanently, making long-term reliability essential. Key drivers for reliability testing include: Ensuring measurement stability over decades Minimizing drift and recalibration needs Predicting service life under harsh conditions Meeting industry standards and certifications Reducing the total cost of ownership (TCO) Core Components Subject to Reliability Testing A fiber optic temperature system is not a single component but a system of interacting elements, each with unique aging mechanisms. Component Function Reliability Concern Optical fiber Temperature sensing medium Coating degradation, attenuation increase Sensing element (FBG, Raman, phosphor, FP) Temperature encoding Drift, fatigue, contamination Connectors & splices Signal continuity Insertion loss, moisture ingress Interrogator unit Signal processing Laser aging, electronics failure Cables & sheathing Environmental protection Chemical, UV, and mechanical damage Long-term testing must evaluate both individual components and the integrated system. Major Long-Term Failure Mechanisms Understanding failure mechanisms is the foundation of reliability testing. Optical Fiber Aging Although silica fibers are chemically stable, long-term exposure to heat, radiation, or chemicals can cause: Increased attenuation Micro-crack propagation Coating embrittlement Hydrogen-induced losses Sensor Drift Temperature sensors may experience gradual drift due to: Refractive index changes Mechanical stress relaxation Grating or cavity aging Phosphor material degradation Environmental Stress External factors that accelerate aging include: Thermal cycling High humidity or condensation Chemical corrosion Vibration and mechanical fatigue Interrogator Degradation Electronic and optoelectronic components degrade over time: Laser wavelength drift Reduced signal-to-noise ratio (SNR) Power supply aging Component solder fatigue Types of Long-Term Reliability Tests Reliability testing combines accelerated laboratory tests with real-world field validation. Accelerated Aging Tests Accelerated tests simulate years of operation within a shorter timeframe. Test Type Purpose Typical Conditions High-temperature aging Evaluate thermal stability 85–300 °C for 1,000–10,000 h Thermal cycling Stress expansion and contraction −40 °C to +150 °C Humidity exposure Assess moisture resistance 85 °C / 85% RH UV exposure Outdoor durability UV-A / UV-B lamps Chemical immersion Corrosion resistance Oils, acids, solvents Results are extrapolated using Arrhenius or Eyring models to predict service life. Mechanical Performance Testing Mechanical integrity is essential for installations subject to vibration or movement. Bend fatigue testing Tensile strength retention Vibration and shock testing Crush and abrasion resistance Parameter Typical Requirement Minimum bend radius ≥10× cable diameter Tensile load 1,000–3,000 N Vibration IEC 60068 standards Shock Up to 50 g Optical Performance Stability Testing Measurement accuracy must remain stable over time. Metric Test Objective Temperature accuracy Drift < ±0.1 °C/year Repeatability Stable readings over cycles Resolution No degradation over time Signal attenuation <0.02 dB/km/year These tests often run continuously for months or years. Distributed Temperature Sensing (DTS) Reliability Testing DTS systems present unique challenges due to their long sensing range. Fiber Length Stability Testing verifies performance over tens of kilometers, focusing on: Attenuation growth Raman signal stability Spatial resolution consistency Raman Scattering Stability Because DTS relies on the ratio of Stokes and Anti-Stokes signals, reliability testing examines: Laser pulse stability Backscatter intensity consistency Temperature coefficient stability DTS Parameter Long-Term Target Temperature drift ≤ ±1 °C over 10 years Spatial resolution No degradation Measurement repeatability ±0.5 °C Fiber lifetime >25 years Field Reliability and Long-Term Deployment Studies Laboratory tests alone are insufficient. Field testing validates performance under real conditions. Pilot Installations Manufacturers deploy systems in: Power substations Oil pipelines Rail tunnels These sites provide long-term data on: Environmental exposure Installation-induced stress Maintenance requirements Continuous Monitoring Data Reliability is evaluated through: Trend analysis Drift detection Alarm consistency Failure statistics Standards and Qualification Frameworks Long-term reliability testing is guided by international standards. Standard Scope IEC 61757 Fiber optic sensor performance IEC 60068 Environmental testing Telcordia GR-20 / GR-326 Fiber and connector reliability IEEE 1613 Power utility environments ISO 9001 Quality management Compliance ensures repeatable, auditable, and comparable results. Data Analysis and Lifetime Prediction Reliability testing produces large datasets that must be analyzed correctly. Statistical Methods Common techniques include: Weibull analysis Mean Time Between Failures (MTBF) Confidence interval modeling Lifetime Estimation Models Model Application Arrhenius Thermal aging Eyring Multi-stress environments Coffin–Manson Thermal fatigue Miner’s rule Cumulative damage These models translate accelerated test data into real-world lifetime predictions. Maintenance and Recalibration Strategy Validation Long-term testing also validates maintenance intervals. System Type Typical Recalibration Interval FBG systems 5–10 years DTS systems 10–15 years Fluorescence sensors Minimal Fabry–Perot sensors 5–10 years Well-designed systems often achieve maintenance-free operation for over a decade. Emerging Trends in Reliability Testing Reliability testing continues to evolve alongside technology. Key trends include: AI-driven drift detection Digital twin-based aging simulation Multi-parameter reliability testing (temperature + strain + vibration) Smaller, more stable laser sources Predictive maintenance analytics These advances reduce uncertainty and further extend system lifetime. Long-term reliability testing ensures fiber optic temperature systems deliver durable, low-maintenance performance in demanding environments, making it essential for long-term, mission-critical monitoring.

Fiber Optic Temperature Sensor Work Principle
Blogs

Fiber Optic Temperature Sensor Working Principle: A Complete Technical Guide

Fiber optic temperature sensors are now a key measurement solution in industries that demand high accuracy, safety, and reliability. Unlike conventional electrical temperature sensors, fiber optic sensors use light instead of electricity, making them immune to electromagnetic interference and suitable for extreme or hazardous environments. This article provides a deep technical explanation of how fiber optic temperature sensors work, the core sensing mechanisms, different sensor types, and where each technology is best applied. What Is a Fiber Optic Temperature Sensor? A fiber optic temperature sensor measures temperature by monitoring how changes in heat affect light transmission within an optical fiber. The sensor consists of: A light source An optical fiber acting as the sensing medium A detector/interrogator that interprets the returned signal Because optical fibers are dielectric (non-conductive), these sensors are inherently safe in high-voltage, explosive, or electromagnetically noisy environments. Fundamental Working Principle The working principle of fiber optic temperature sensors is based on the fact that temperature affects optical properties, such as: Refractive index Optical path length Light wavelength Light scattering intensity Phase or frequency of light When temperature changes, it alters how light travels through, reflects from, or scatters within the fiber. These changes are measured and converted into accurate temperature values. Core Physical Effects Used: Thermal expansion Thermo-optic effect Inelastic scattering Optical interference Main Fiber Optic Temperature Sensing Technologies Fiber optic temperature sensors can be categorized by how temperature information is encoded in light. Major Fiber Optic Temperature Sensing Technologies Technology Measurement Principle Temperature Encoding Method Fiber Bragg Grating (FBG) Wavelength shift Reflected Bragg wavelength Distributed Temperature Sensing (DTS) Raman scattering Backscattered light intensity Interferometric Sensors Phase change Optical phase difference Fluorescence-Based Sensors Decay time Fluorescence lifetime Fabry–Perot Sensors Cavity length change Interference pattern shift Fiber Bragg Grating (FBG) Temperature Sensor Principle How It Works An FBG sensor contains a microscopic periodic structure (grating) inscribed inside the fiber core. This grating reflects a specific wavelength, referred to as the Bragg wavelength. When temperature changes: The fiber expands or contracts The refractive index changes The reflected wavelength shifts proportionally Advantages High accuracy Fast response Suitable for multi-point sensing Limitations Cross-sensitivity to strain (requires compensation) Distributed Temperature Sensing (DTS) Working Principle Distributed Temperature Sensing continuously monitors temperature along the full length of an optical fiber, often across distances of tens of kilometers. Raman Scattering Mechanism A short laser pulse is sent into the fiber. As light interacts with the fiber material, Raman backscattering occurs, producing: Stokes signal (temperature-independent) Anti-Stokes signal (temperature-dependent) The intensity ratio between these signals determines the temperature at each point. Interferometric Fiber Optic Temperature Sensors Interferometric sensors rely on optical phase changes caused by temperature variations. Common Types Mach–Zehnder Michelson Sagnac Principle Temperature alters the optical path length of one arm of the interferometer, causing a phase shift when compared to a reference arm. This phase difference is detected as interference fringes. Key Characteristics Extremely high sensitivity Suitable for micro-temperature changes Complex signal processing required Fluorescence-Based Fiber Optic Temperature Sensors These sensors use temperature-dependent fluorescence decay time. How It Works A phosphor material at the fiber tip is excited by light The material emits fluorescence The decay time of fluorescence changes with temperature Key Advantage Insensitive to signal loss and fiber bending Excellent stability in harsh environments Common Use Medical devices Power transformer winding monitoring Fabry–Perot Fiber Optic Temperature Sensor Principle A Fabry–Perot sensor consists of two reflective surfaces forming an optical cavity. Temperature Effect Temperature changes cause cavity length expansion This shifts the interference pattern The shift is correlated to temperature Benefits High resolution Compact design Suitable for point sensing Comparison of Fiber Optic Temperature Sensor Types Sensor Type Measurement Range Accuracy Response Time Typical Applications FBG −200 to 300 °C ±0.1 °C ms Power systems, aerospace DTS (Raman) −40 to 600 °C ±1–2 °C seconds Pipelines, tunnels Interferometric Narrow ±0.01 °C ms Scientific research Fluorescence −200 to 450 °C ±0.5 °C ms Medical, transformers Fabry–Perot −50 to 400 °C ±0.1 °C ms Industrial monitoring Advantages Over Traditional Temperature Sensors Fiber optic temperature sensors outperform thermocouples and RTDs in several key areas: Electromagnetic immunity Electrical isolation Intrinsic safety Long-distance measurement Multiplexing capability Resistance to corrosion and moisture Environmental and Industrial Suitability Fiber optic temperature sensors are ideal for: High-voltage environments Explosive atmospheres Strong electromagnetic fields Corrosive chemicals Remote or inaccessible locations They are widely deployed in: Power generation Oil & gas Rail transportation Smart infrastructure Industrial automation Signal Processing and Interrogation Systems The interrogator is the brain of a fiber optic temperature sensing system. It performs: Light generation Signal demodulation Temperature calculation Data transmission Advanced systems integrate: Digital signal processing (DSP) AI-assisted anomaly detection Real-time alarms SCADA or IoT platforms Calibration and Accuracy Considerations To ensure accuracy: Sensors are factory-calibrated Temperature-strain compensation may be required Environmental factors such as bending radius and aging must be considered Future Trends in Fiber Optic Temperature Sensing Key developments include: Higher spatial resolution DTS Multi-parameter sensing (temperature + strain + vibration) Smaller interrogators AI-driven predictive maintenance Integration with digital twins The working principle of fiber optic temperature sensors is rooted in light–matter interaction, enabling precise temperature measurement without electrical conduction. Through technologies such as FBG, DTS, interferometric, fluorescence, and Fabry–Perot sensing, fiber optic temperature sensors provide unmatched safety, scalability, and performance. As industries demand smarter, safer, and more connected monitoring solutions, fiber optic temperature sensing will continue to play a critical role in next-generation industrial and infrastructure systems.

Energy-Efficient PIDS Security Systems
Blogs

Green and Energy-Efficient PIDS Security Systems: Solar Power and Low-Consumption Designs

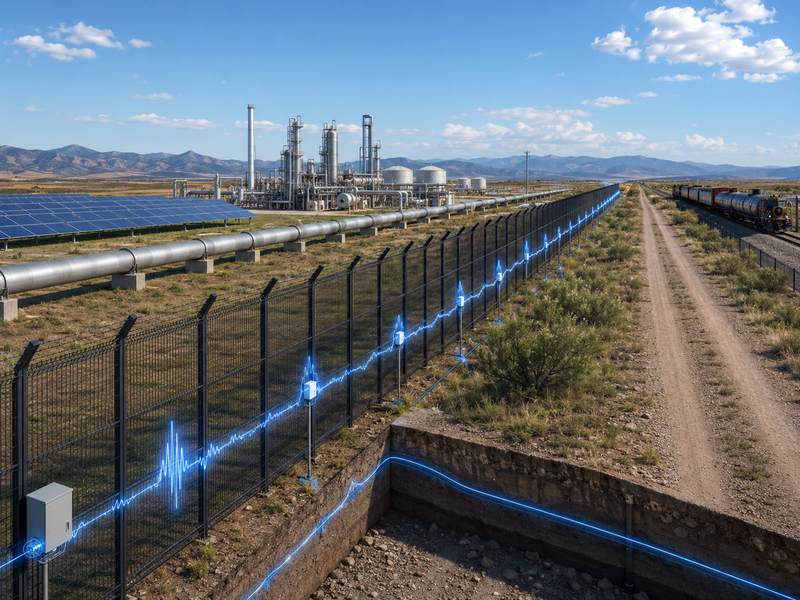
As energy costs rise and ESG reporting becomes standard, security managers must protect long, remote perimeters while reducing their environmental footprint. Modern PIDS help by using solar power, low-consumption sensors, smart lighting, and efficient analytics to deliver greener, more cost-effective security. Why Sustainability Matters in Perimeter Security The physical security industry is moving quickly toward sustainability. Major manufacturers, integrators, and end-users are aligning security investments with environmental, social, and governance (ESG) goals, aiming to reduce energy use and hardware waste without compromising safety. Key drivers include: Energy costs and carbon footprint – Always-on cameras, lighting, and servers can consume significant power. Green security aims to reduce this load through efficient hardware and smarter operation. ESG and stakeholder expectations – Investors, regulators, and customers increasingly expect security systems to support sustainability initiatives, not work against them. Difficult power access – Remote solar farms, wind parks, pipelines, and substations may lack reliable grid infrastructure, making low-consumption, solar-powered PIDS not just “nice to have,” but essential. In this context, designing PIDS as a green, energy-efficient platform is both a security decision and a strategic sustainability choice. What Makes a PIDS “Green” and Energy-Efficient? A Perimeter Intrusion Detection System (PIDS) is any system deployed outdoors to detect attempts to breach a protected boundary—typically using fence-mounted sensors, buried detection, radar, or beams. A green PIDS has three main characteristics: Low operational power – Sensors, cameras, communication modules, and controllers are chosen and configured to use minimal energy, often suitable for solar or hybrid power. Some fiber-optic and fence-mounted systems are specifically designed with low-power electronics and optional battery backup. Efficient infrastructure – Long-range or wide-coverage devices reduce the number of poles, cabinets, and trenching needed, cutting both material and energy use. Radar- and AI-based perimeter solutions, for example, can cover hundreds of meters from a single unit, requiring fewer powered points. Smart, event-driven operation – Instead of running everything at full power 24/7, green PIDS focuses on event-based recording, analytics, and lighting—saving energy while keeping security strong. Key Energy-Efficient PIDS Components Fence-mounted fiber-optic sensors – Use light instead of copper, support long runs, and can monitor an extended fence line from a few head-end units. Low-power radars and wide-area sensors – Offer long detection ranges with low power and bandwidth requirements, minimizing field infrastructure. Solar-powered IR beams and motion sensors – Provide intrusion detection across gates, paths, and open areas without grid power. LED perimeter lighting with motion control – Uses far less power than old sodium or halogen lights; can be triggered only on alarm or presence. Video analytics and H.265/H.265+ compression – Reduce server load and storage capacity needed while preserving forensic-quality video. Conventional vs Green PIDS at a Glance Aspect Conventional PIDS Green / Energy-Efficient PIDS Power Source Grid-only, often oversized Solar, hybrid, or optimized grid usage Field Hardware Many short-range devices Fewer long-range sensors and radars Lighting Always-on perimeter lighting LED + motion / event-based control Data & Storage Continuous recording, older codecs Event-driven recording, advanced compression Sustainability Impact High energy and material footprint Designed to minimize energy use and waste Solar-Powered PIDS: Off-Grid and Sustainable Many contemporary green PIDS architectures are powered by solar energy. Solar-powered beams, radars, and fence-mounted sensors make it possible to protect remote or off-grid perimeters with minimal environmental impact. How Solar-Powered PIDS Work A typical solar-powered PIDS field point includes: Solar panel sized for local irradiance and load Charge controller to manage charging and protect batteries Battery pack (often lithium or AGM) sized for several nights of autonomy Low-power sensor(s) – IR beams, motion sensors, small cameras, or radar Wireless communication to a central gateway or receiver Commercial solar-powered perimeter alarms demonstrate what’s possible: long-range wireless beams and siren units powered entirely by solar energy, with field devices up to several hundred feet apart and communication ranges reaching 3000 ft or more. Similarly, solar-powered vibration detection and fence-mounted systems are now offered by specialized perimeter security vendors, enabling energy-efficient intrusion detection without trenching power cables along the fence. Partnerships between solar pole manufacturers and radar-based perimeter providers have also made fully off-grid, solar-powered radar PIDS a reality, combining advanced detection with clean energy. Ideal Use Cases for Solar PIDS Solar-powered PIDS solutions are especially effective for: Solar farms and renewable energy plants – Using green power to protect green energy assets is both symbolic and practical; radar, buried sensors, and fence detection can be powered from solar poles. Remote farms, ranches, and estates – Solar beams and wireless receivers secure driveways, fence lines, and barns where grid power is unavailable or expensive. Pipelines and remote infrastructure – Off-grid or hybrid PIDS nodes along a pipeline or access road can integrate into a central command center via cellular or radio links. Temporary or mobile deployments – Construction sites, temporary storage yards, and event perimeters can be protected without permanent power infrastructure. In all these scenarios, solar-powered PIDS reduce cabling, trenching, and connection to utility power, shrinking both project CAPEX and environmental impact. Low-Consumption Designs Across the PIDS Stack Green PIDS are not only about solar panels. The full stack—sensors, computing, communications, and management—must be optimized. Low-Power Sensors and Electronics Manufacturers increasingly design fence sensors and processing units to use minimal power while maintaining high detection sensitivity. For example, fiber-optic fence sensors can cover long distances with a single controller, reducing the number of powered enclosures in the field. Energy-efficient sensor types include: Passive infrared (PIR) sensors – Known for their simplicity and low power draw, commonly used for presence detection around perimeters. Photobeam/IR barriers with sleep modes – Designed to operate at microamp standby currents, waking into full power only when sampling or alarming. Long-range radars with low bandwidth – Some radar-based perimeter solutions emphasize low power and minimal data transmission, making them well suited for solar and wireless deployments. Smart Power Management and Edge Computing Intelligent power management dramatically reduces total energy use: Event-driven activation – Cameras record at full frame rate only when a PIDS event occurs; otherwise, they operate at lower rates or in standby. Edge analytics – Processing video and sensor data at the edge reduces bandwidth and storage requirements. Modern VMS platforms highlight edge analytics and advanced compression

Optimize Fence Security System
Blogs

Using Fence Security Systems to Reduce Guard Costs and Improve Incident Response

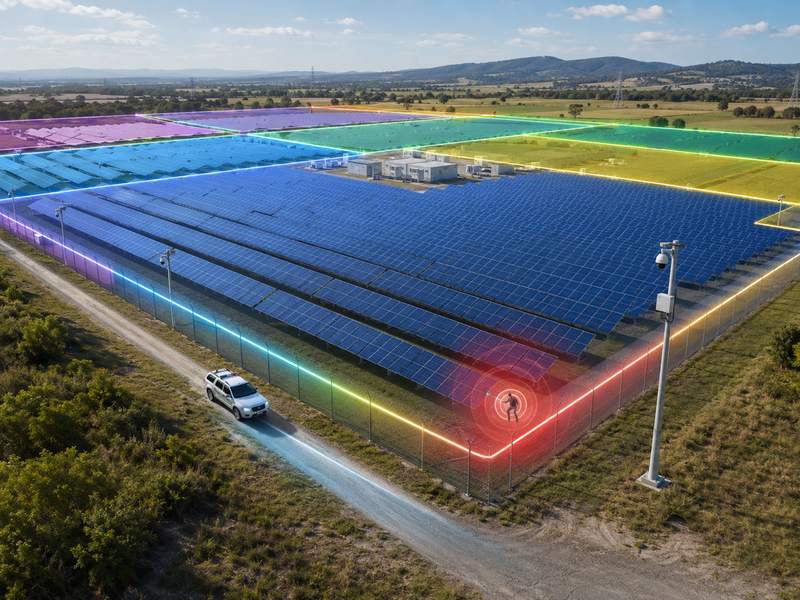
Security guards are often one of the largest recurring expenses in a physical security budget. At the same time, many sites still struggle with slow incident response, missed events, and blind spots along the fence line. Modern fence security systems—combining sensors, cameras, analytics, and remote monitoring—offer a way out of this trade-off: better security at a lower long-term cost. This article explains how to use fence security systems to reduce dependence on manned patrols, cut guard costs, and dramatically improve incident response. Why Guard-Only Security Is So Expensive (and Limited) Traditional security models rely on on-site guards patrolling the perimeter, watching gates, and responding when something “looks wrong.” The problem is that this approach scales badly: You pay for 24/7 staffing: wages, overtime, benefits, and training. Coverage is naturally constrained because guards can only be in one location at a time. Night shifts and large perimeters often lead to fatigue and missed events. Industry comparisons show that fully manned gate or perimeter guard setups can cost well into six figures per year per site, while virtual/remote guarding or automated systems typically cost a fraction of that—often 40–90% less over the long term. At the same time, modern perimeter systems (fence sensors, cameras, analytics, and integrated alarms) are designed to detect, verify, and escalate incidents in a consistent way, without fatigue or distraction. What a Fence Security System Actually Does A fence security system is more than just a physical fence. It’s a layered detection and response platform built around the fence line. A typical solution combines: Fence-mounted intrusion detection (PIDS/FIDS): vibration, fiber-optic, or microphonic sensors detect cutting, climbing, or lifting of the fence. Perimeter video: fixed and PTZ cameras monitor the fence line and integrate with video management systems (VMS). Perimeter lighting: supports both deterrence and clear video images. Analytics and AI: distinguish people from animals or weather, reducing false alarms. Alarm and event management: rules and workflows route alarms to local guards or remote monitoring centers. When designed properly, the fence becomes an intelligent tripwire: as soon as someone touches or approaches it, the system detects, verifies, and triggers a defined response. How Fence Systems Reduce Guard Costs Replace Continuous Patrols with Event-Driven Monitoring One of the biggest cost advantages comes from shifting from time-based patrols to event-driven response. Instead of guards walking the fence every 30–60 minutes, the fence itself is continuously monitored by sensors and cameras. Guards—either on-site or remote—only react when: A fence sensor triggers an alarm Video analytics detect a person breaching the perimeter A rule (e.g., after-hours motion in a no-go zone) is violated Remote and virtual guarding studies show that using smart surveillance and integrated alarms allows a much smaller team to monitor more sites, near-continuously, at a far lower cost than full manned coverage. Consolidate Guard Posts With an automated fence line: You may no longer need a guard at every gate or perimeter tower. One guard in a control room (or a remote monitoring center) can handle multiple entrances and dozens of cameras. Some sites move from three guards per shift to one supervisor plus remote monitoring, cutting on-site headcount significantly. Case studies from remote perimeter monitoring providers show annual cost reductions of 50–80% when replacing or downsizing 24/7 guard posts with integrated perimeter systems and remote operators. Lower Indirect Costs and Risk Electronic fence security also reduces “hidden” guard costs: Fewer incidents (trespass, theft, vandalism) due to earlier detection and stronger deterrence Lower liability from guard errors, fatigue, or confrontations Potential insurance benefits for sites with documented perimeter protection and video coverage When incidents are caught at the fence instead of inside the facility, loss severity and downtime fall, further strengthening the financial case. Simple Cost Comparison (Illustrative) Model Staffing / Operation Typical Cost Profile* Guard-only perimeter Multiple guards per shift; full patrols Very high annual OPEX (wages, overtime) Hybrid: guards + fence system Smaller on-site team, event-driven patrols Medium OPEX + moderate CAPEX Remote/virtual guarding Minimal or no on-site guards Low OPEX; higher CAPEX, strong ROI *Exact numbers vary by country and site, but multiple industry examples show virtual/perimeter-based models at 40–80% lower annual cost than guard-only setups. How Fence Systems Improve Incident Response Cutting costs is not enough; security also needs to get better. Well-designed fence systems do exactly that by enabling earlier detection, clearer verification, and faster, more coordinated response. Detect Earlier—At the Edge of the Site Perimeter intrusion detection systems (PIDS) are designed to detect intruders at the earliest possible moment—when they attempt to climb, cut, lift, or tunnel near the fence. This has two big advantages: You gain time to respond before an intruder reaches critical assets. You reduce the number of “mystery alarms” inside the site, because most incidents are triggered and verified at the boundary. Guidance on modern perimeter systems emphasizes that early perimeter detection plus integrated video gives security teams crucial minutes to assess and respond, often before incidents escalate. 4.2 Automate the First Response When a fence sensor or analytic rule triggers, the system can automatically: Pop up the relevant camera views on a video wall Zoom PTZ cameras to the alarm location Activate strobe lights or sirens at the fence Lock or restrict access at nearby gates Send push notifications and snapshots to guards’ mobile devices Automation removes seconds—or even minutes—of delay that happen when guards must manually search for the right camera and decide what to do. It also ensures consistent responses every time, independent of who is on shift. 4.3 Provide Clear, Actionable Information Modern systems don’t just beep; they contextualize incidents: Video analytics highlight people and vehicles, filtering out animals, rain, or foliage movement. Maps or dashboards show exact zones and sensor IDs for each alarm. Event logs record who acknowledged what, when, supporting audits and investigations. This clarity helps guards make faster, better decisions, while supervisors can refine procedures based on real data. Before vs After Fence System Deployment Step Guard-Only Model With Fence Security System Detection Guard on patrol spots something (or not) Fence sensor or analytics auto-detects an intruder Verification The guard walks / drives to check the area Camera auto-positions;

Fence Security System Layout to Eliminate Blind Spots
Blogs

How to Optimize Fence Security System Layout to Eliminate Blind Spots

Designing a strong fence is only half the job. If your security system layout leaves blind spots—areas that cameras, sensors, or lighting don’t properly cover—intruders will find and exploit them. A well-planned fence security system focuses on continuous, overlapping coverage so every meter of perimeter is monitored and verified. This guide walks you through how to design or upgrade your fence security layout so blind spots are found and eliminated before criminals find them. Start with a Perimeter Risk Assessment Before placing a single camera or sensor, you need a clear understanding of the perimeter you’re protecting. Key steps: Map the property: Create a scaled plan showing fence lines, corners, gates, access roads, parking areas, loading bays, and nearby buildings. Identify high-risk zones: Focus on secluded areas, poorly lit stretches, blind alleyways, and spots near public roads or neighboring buildings where intruders can hide or stage tools. Note environmental constraints: Trees, slopes, walls, containers, metal structures, and water can affect camera views, IR/microwave sensors, and RF interference. Check existing systems: Document current cameras, fence sensors, motion detectors, lighting, and alarm routes. Mark where alarms frequently occur and where incidents have already happened. This assessment becomes the foundation for all layout decisions. It also helps you justify budget and technology choices later. Understand Where Blind Spots Come From Blind spots are not random; they usually come from predictable design issues. Recognizing these makes them easier to remove. Common causes of fence blind spots: Camera fields of view that don’t overlap or are aimed incorrectly “Dead zones” directly under cameras or behind posts and columns Corners and turns where cameras or sensors don’t fully cover the angle Dark stretches of fence due to uneven lighting or burned-out fixtures Vegetation, parked vehicles, containers, or signage blocking sensors Elevation changes (slopes, mounds, ditches) affecting line-of-sight sensors Poorly routed cabling for fence-mounted systems creates gaps in detection A good layout deliberately addresses each of these. Quick Reference: Typical Blind Spot Sources & Fixes Blind Spot Source Typical Cause Primary Fix Under cameras (“dead zone”) Camera mounted too high/close Overlapping camera or adjusted angle Dark fence stretch Poor lighting, spacing, or glare Even overlapping lighting along the fence Corners & gate posts Single device tasked with two angles Dedicated corner/gate camera or sensor Vegetation & clutter No clear zone near the fence Maintain a vegetation-free strip Sensor gaps on the fence Incorrect zone lengths or routing Re-segment sensors; follow manufacturer spec Segment the Perimeter into Independently Monitored Zones Instead of treating the fence as one long line, divide it into zones—straight runs between corners, gates, or key structures. Many regulatory and design guides recommend segmenting the perimeter so each zone can be independently monitored and alarmed. For each zone, define: Zone length: Based on sensor/cable limitations and camera performance. Zone type: Straight run, corner, gate, or high-risk section. Target detection method: Fence-mounted sensors, buried cable, IR beams, or a combination. Assessment method: Fixed cameras, PTZ (pan-tilt-zoom) cameras, thermal cameras, or on-site response. Zoning makes it easier to pinpoint alarm locations, reduces the chance of long, unmonitored stretches, and simplifies maintenance and troubleshooting. Design Overlapping Camera Coverage Cameras are your primary verification tool, so their placement is critical for eliminating blind spots. Use Overlapping Fields of View Best-practice guidance recommends overlapping camera coverage zones so one camera’s field of view includes the blind spot of the next camera. Practical tips: Overlap 10–20% of coverage: Where one camera’s view ends, the next should already be watching. Cover camera “dead zones”: The area directly below each camera is usually a blind spot; ensure the next camera covers this region. Use complementary lenses: Combine wide-angle cameras (for general perimeter tracking) with narrow-angle or PTZ cameras (for high-detail identification at gates and choke points). Optimize Height and Angle Camera height and angle have a huge impact on coverage: Mount cameras at a sufficient height (e.g., 4 m or higher on poles or buildings) and tilt them downwards to reduce sky and maximize ground coverage. Aim fields of view parallel to the fence line and perpendicular to expected intruder movement—this gives longer tracking time and better detection probability. Avoid placing cameras so close to the fence that they only see a narrow strip; you want enough depth to track movement on both sides. Plan Fence Sensor Layout for Continuous Detection Fence-mounted perimeter intrusion detection systems (PIDS/FIDS) can detect climbing, cutting, or lifting attempts along the fence line. To eliminate blind spots, the sensor layout must be as continuous as the fence itself. Follow Sensor Zoning and Cable Rules Guidance for barrier-mounted systems generally recommends: Only the sensor cable should be mounted on the fence; other cabling should, where possible, be at a stand-off to reduce vulnerability and noise. Design clear detection zones and keep within the maximum zone length recommended by the manufacturer to maintain sensitivity and avoid weak spots. Use a clear zone along the fence—free of vegetation, debris, and adjacent objects—to prevent interference with sensor performance and reduce false alarms. Combine Technologies for High-Risk Areas A dual-layer approach—combining fence-mounted detection with secondary technologies (e.g., buried cable, IR beams, radar, or thermal cameras)—can cover blind spots in very high-risk zones or complex terrain. Examples: Fence-mounted sensor + thermal camera at remote, dark perimeter stretches Fence-mounted sensor + microwave barrier across open ground near a road Fence-mounted sensor + active IR beams at vehicle gates and side entrances Layering ensures that if one technology is temporarily degraded (e.g., by heavy wind or rain), another still provides coverage. Use Strategic Lighting to Remove Dark Zones Even the best cameras and sensors struggle when visibility is poor. Proper perimeter lighting is essential to remove hiding places and support video analytics. Key principles: Uniform illumination: Avoid “spotty” pools of light separated by darkness. Even, continuous lighting reduces shadows and hiding places. Overlap light beams: Space lights so each beam reaches into the next, similar to camera overlap, to eliminate dark gaps along the fence. Control glare: Too much glare reduces camera image quality and makes it hard for guards to see. Select fixtures and angles that light the fence line, not the

Fence Alarm System
Blogs

What is a Fence Intrusion Detection System?

Advanced Fence Intrusion Detection Systems (FIDS) provide real-time solutions to prevent unauthorized access and threats. Gato Security leads with innovative FIDS solutions for enhanced perimeter security, offering rapid responses, precise monitoring, and seamless integration with other technologies. This article covers what FIDS are, how they work, and their applications. What is a Fence Intrusion Detection System? A Fence Intrusion Detection System (FIDS) is a sophisticated security solution designed to monitor the integrity of a perimeter fence. It detects and alerts security personnel about any unauthorized activity along the fence, such as climbing, cutting, or moving along it. This proactive system serves as the first line of defense against intruders, particularly in sensitive or high-risk areas where physical barriers alone are not enough to prevent breaches. FIDS use various detection technologies to monitor the perimeter, including vibration, acoustic, fiber optic sensors, and infrared beams, which allow them to detect even the slightest disturbances. These systems are essential for protecting crucial infrastructure, military installations, power plants, and borders. Gato Security specializes in offering adaptable FIDS solutions that include cutting-edge technology to improve its clients’ operational effectiveness and security. How Do Intrusion Detection Systems for Fences Operate? The operation of a FIDS involves the use of sensors placed along the fence to detect any abnormal movement or changes in environmental conditions. These sensors communicate with a central control system that evaluates the data and triggers an alert when a potential intrusion is detected. Subsection A: Sensing Technologies There are several technologies used in FIDS that allow them to detect disturbances along the fence line. Some of the most common technologies include: Technology Working Principle Advantages Applications Vibration Sensors Detects movement through vibrations. Highly sensitive to small movements. Airports, government facilities. Fiber Optic Sensors Monitors changes in light signals within fiber cables. Accurate, highly secure. Critical infrastructure. Infrared Beams Uses infrared light to detect interruption. Quick detection in open areas. Border security, high-risk areas. Each of these technologies has a unique set of benefits, and the particular needs of the application determine which system is best. For example, Gato Security integrates fiber-optic sensors in high-security zones due to their robustness and precision, ensuring that intrusions are detected with minimal false alarms. Important Elements of a Fence Intrusion Detection System FIDS are made up of a number of essential parts that cooperate to offer complete security. These components include sensors, control panels, and power supply systems. Subsection A: Sensors The sensors are the heart of the system. They are responsible for detecting disturbances along the fence line. Depending on the technology used, sensors can detect vibrations, pressure changes, or even breakage in the fiber optic cables. Gato Security provides a range of sensor types, from basic vibration sensors to advanced fiber-optic sensing systems, each designed to meet the unique needs of different applications. Subsection B: Control Panels The control panel receives signals from the sensors, processes the data, and triggers an alert when an intrusion is detected. This central unit is also responsible for managing other aspects of the system, including system diagnostics, sensor calibration, and communication with other security systems, such as surveillance cameras and access control systems. Subsection C: Power Supply and Backup An uninterrupted power supply is essential for ensuring that the FIDS remains functional at all times. Backup power options from Gato Security enable the system to continue operating even in the event of a power interruption. This ensures that security is maintained without any interruption, especially in critical areas like power plants or military installations. Different Fence Intrusion Detection System Types In general, there are two types of FIDS: passive systems and active systems. Both types of systems offer distinct advantages based on the specific security needs. Subsection A: Passive Systems Passive systems rely on detecting natural disturbances in the environment, such as vibrations or acoustic signals, without emitting any signals of their own. These systems are typically less intrusive and more cost-effective, making them ideal for applications such as wildlife reserves or low-risk areas. Subsection B: Active Systems Active systems send out signals (e.g., infrared or microwave signals) along the fence and detect disruptions in these signals caused by intruders. These systems are appropriate for high-security settings like military installations, airports, and vital infrastructure since they are more sensitive and offer faster detection. System Type Description Example Use Case Advantages Passive Systems Detects disturbances without emitting any signals. Forests, wildlife reserves. Cost-effective, minimal maintenance. Active Systems Uses signals that are disturbed by intruders. Military bases, prisons. High accuracy, customizable. Gato Security offers both passive and active systems, allowing clients to choose the system that best fits their security needs and budget. Use of Intrusion Detection Systems for Fences Numerous applications in various industries employ FIDS. Among the most popular applications are: Section A: Essential Infrastructure FIDS are crucial for protecting vital infrastructure, including telecommunications centers, power plants, and water treatment facilities. These systems provide real-time alerts of any unauthorized access, ensuring that vital resources are protected. Section B: Military and Government Government buildings and military installations frequently need more security. FIDS play a crucial role in protecting these sensitive areas from potential threats and unauthorized intrusions. Subsection C: Industrial & Commercial In the industrial and commercial sectors, FIDS are used to protect warehouses, factories, and data centers from theft, vandalism, and other security breaches. Businesses may guarantee complete perimeter protection by combining FIDS with other security measures like access control systems and video cameras. Advantages of Using a Fence Intrusion Detection System There are several key benefits to implementing a fence intrusion detection system, including: Enhanced Security: Provides real-time detection of intrusions, allowing for a swift response. Cost-Effectiveness: Reduces the need for large security teams while maintaining high security levels. Deterrent Effect: Potential intruders are discouraged by the loud or visible alerts. Advantage Explanation Enhanced Security Provides immediate detection and faster response times. Cost-Effective Minimizes the need for human patrols or security guards. Scalability Easily expandable to cover large perimeters with minimal additional infrastructure. Gato Security ensures that all systems are scalable, allowing businesses to expand their

Leave Your Message