


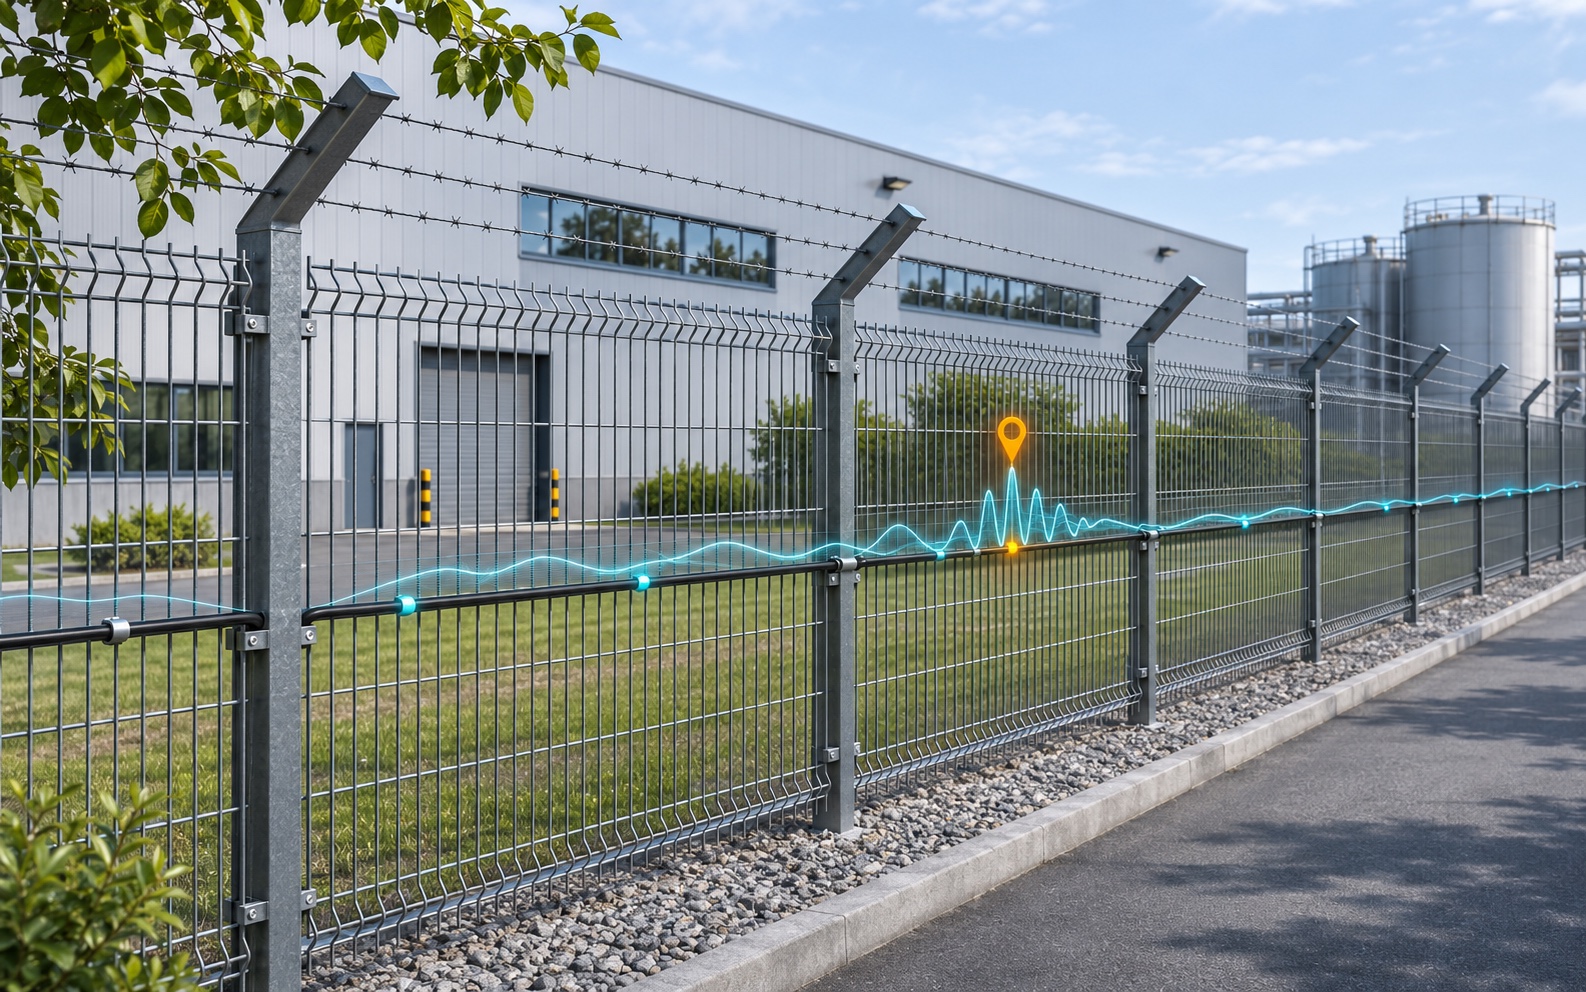
DAS sensing range, spatial resolution and alarm location accuracy answer different questions: how far the instrument can interrogate fiber, how it responds to spatially separated disturbances, and how close a reported alarm is to a known event position. Compare all three in the operating configuration proposed for the installation.
For perimeter security, the objective is to detect the specified intrusion and direct responders to the correct location within an agreed time. A dense channel display alone proves neither disturbance separation nor positioning accuracy. Useful specifications connect measurement settings, installation conditions and repeatable acceptance tests.
What Each DAS Specification Means
Distributed acoustic sensing (DAS) turns an optical fiber into a distributed vibration-sensing element. The following fields should remain separate in a procurement comparison.
| Specification | Practical meaning | What the buyer should request |
|---|---|---|
| Sensing range | Usable interrogation distance along the fiber | Optical loss budget, channel arrangement and operating settings |
| Spatial resolution | Spatial response under a stated measurement definition | Definition, response curve and reproducible test method |
| Alarm location accuracy | Error between a reported alarm and its known reference position | Error statistics on the mapped, installed route |
| Channel spacing | Interval between reported measurement positions | Configured interval, sample capacity and acquisition window |
| Gauge length | Fiber interval used for the strain measurement | Selected length and its effect on spatial response and sensitivity |
Range Is Optical Distance, Not Simply Perimeter Length
Sensing range describes distance along the optical path. Lead-in cable, service loops and repeated passes consume fiber even where they add no protected boundary. A route schedule should therefore show total connected fiber, the monitored perimeter and any excluded sections.
For an illustrative layout, an 8 km boundary reached through a 2 km lead-in already needs 10 km of optical path before allowing for service loops or repeated runs. This is route accounting, not a product-range claim. The drawings must also identify which fiber sections should generate intrusion alarms.
Confirm whether the quoted distance applies per optical channel or across several channels. The loss budget must include fiber attenuation, connectors, splices and bends. Far-end performance also depends on the event signal and background noise; an optical return alone does not establish reliable intrusion detection.
AP Sensing’s technical overview describes how fiber loss and signal conditions affect reach. It also explains the repetition-rate constraint of conventional pulse interrogation: the previous pulse’s return must be accommodated before the next pulse. Check usable acoustic bandwidth together with distance, rather than combining figures from incompatible modes.
Spatial Resolution, Channel Spacing and Gauge Length
Spatial resolution needs a definition before it can support a purchasing decision. The rise or fall of an extended-source response and the ability to distinguish nearby disturbances are related tests, but they do not measure exactly the same thing. Record the excitation geometry and processing settings behind the quoted result.
Channel spacing describes the output grid. Closely spaced channels can share overlapping measurement regions. Finer sampling can represent a response more adequately when the original sampling is too coarse, but adding samples does not by itself establish finer independent spatial resolution.
In phase-based DAS reporting strain, gauge length is the fiber interval over which the measurement is derived. Changing it affects spatial averaging and sensitivity. Effective spatial response also depends on pulse characteristics and processing. Evaluate the complete measurement configuration when interpreting the result.
A concrete example is the Silixa iDAS-MG 2026 V2 datasheet. It specifies sample spacing from 25 cm to 32 m, with 40,000 samples maximum, and defines spatial resolution using an extended-source rise/fall length equal to one gauge length. These are model-specific statements. Confirm how the chosen interval, active acquisition window and sample capacity fit the required coverage; separately listed limits are not automatically simultaneous operating capabilities.
Location Accuracy Requires a Verified Route Map
Alarm location accuracy concerns the difference between the reported event position and a known physical reference. Specify whether error is measured along the perimeter or in map coordinates. A sufficiently clear isolated response may be localized more finely than its spatial response width, under the applicable measurement conditions.
Define the event reference before calculating error. On a flexible fence, a climbing action can excite several panels; the reported position may represent a response peak rather than the agreed contact point. The test record should identify the reference, event timing and route-coordinate convention so repeated trials measure the same quantity.
The same iDAS-MG datasheet footnote separately describes point-source localization down to 1 m, depending on interrogation settings. This is a conditional statement about that instrument. Installed perimeter alarm accuracy, event grouping and camera pointing require their own verification.
Optical coordinates must be connected to surveyed route positions. Slack loops, cable diversions and repairs complicate that relationship. Research on DAS channel geolocation describes terrestrial tap tests at surveyed positions as one way to establish channel locations. For a security project, use identifiable reference points and repeat affected checks after route changes.
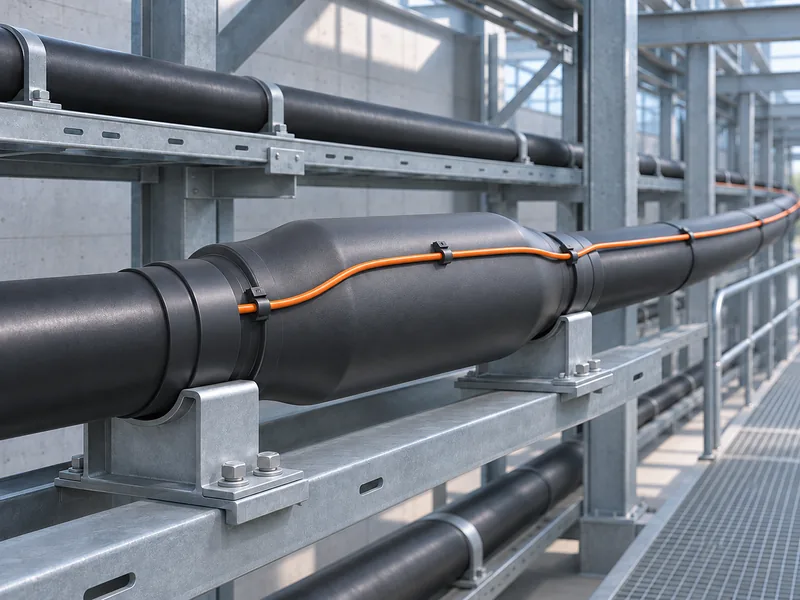
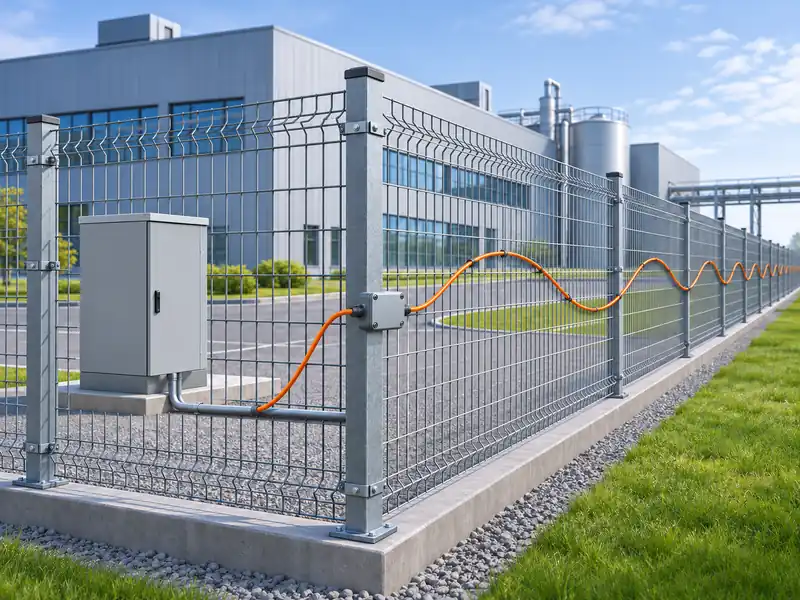
Installation influences the measured response too. Fence attachment and tension, burial construction, soil contact and cable construction affect mechanical coupling. Validate representative sections and transitions rather than assuming that one well-coupled test position represents the entire installation.
Read Research Results with Their Conditions
Request one supported configuration that meets the required range, spatial response, sensitivity and bandwidth together. Coding, diversity or optical amplification may change the trade-offs; the supplier should explain which impairment a technique addresses and show its effect in the offered configuration.
In a 2019 study by Dian Chen, Qingwen Liu and Zuyuan He, researchers reported about 108 km of fiber with 5 m spatial resolution. Their system used time-gated digital optical frequency-domain reflectometry, bidirectional distributed Raman amplification and Hanning-window pulse shaping. The abstract separately describes a weak vibration located at 98 km. These results belong to that research apparatus; they do not establish Gato product specifications or full-route perimeter alarm performance.
For every numerical comparison, retain the model or research apparatus, document revision, fiber conditions and measurement definition. Distinguish spatial resolution from point-source localization and alarm location error. When sensitivity is expressed as a spectral noise density, preserve its frequency and processing conditions rather than treating it as an unconditional minimum detectable intrusion.
The comparison file should name the offered hardware and software versions and separate guaranteed values from indicative figures. An unexplained maximum value needs clarification before it becomes an acceptance criterion. Record the supported operating limits and any exclusions before quotations are evaluated.
Turn the Comparison into an Acceptance Plan
The acceptance plan should convert operational requirements into controlled events and predefined pass criteria. The following steps are procurement recommendations; the project team must agree the event methods, thresholds and observation periods before scored testing.
- Freeze the configuration. Record hardware and firmware, gauge length, sampling, filters, classification settings and route-map version. Identify threat actions, tools and contact points, along with installation types and environmental conditions.
- Measure detection and timing. Calculate detection probability from detected valid trials divided by all valid trials. Define the event start and actionable-alarm timestamp. Report results by threat and route segment, retaining trial counts and failed valid trials.
- Test known-position events. Compare reported alarms with independently measured reference positions. Retain signed errors to reveal systematic offsets, then report absolute-error statistics and the worst observed result. Include far-end sections, transitions and positions between reported channels.
- Test concurrent events separately. Apply two controlled disturbances at defined separations, including overlapping event times and different relative strengths. Specify what counts as two resolved responses. Keep sensor output separate from classifier decisions so measurement overlap and alarm grouping can be distinguished.
- Observe nuisance activity and adverse conditions. Agree an observation period and monitored length. Retain relevant traffic, machinery and weather records. Check that noise suppression preserves the target threats, and repeat critical tests under the conditions specified for acceptance.
A single successful demonstration should not conceal variation between locations or event types. Agree how many valid trials are needed and how uncertainty will be reported. Define invalid trials in advance and retain their reasons. After corrective work, document which settings or installation details changed and which tests must be repeated.
A low nuisance-alarm count is meaningful only alongside required detection performance. A filtering change that removes background activity may also suppress a weak target event. Compare both outcomes in the same documented settings, and include representative background activity rather than evaluating detection and nuisance alarms under unrelated configurations.
The handover package should contain the as-built route map, configuration export, synchronized event records and alarm logs. Include a retest procedure for later cable repairs or installation changes. If alarms steer cameras, verify the resulting view as an operational outcome alongside the reported route position.
Buy a Demonstrated Configuration
Keep range, spatial resolution and alarm location accuracy in separate contractual fields. Require their definitions, settings and installation assumptions to remain attached to each commitment. Select the configuration that demonstrates the required response across the installed route, with usable location information and manageable nuisance alarms.
For a Gato Security project discussion, bring the route drawings, required threat actions and acceptance criteria together. Equipment selection and the testing plan should follow the same operational requirements.
References
- AP Sensing — DAS technical overview
- Silixa — iDAS-MG technical data, 2026 V2
- Holman and colleagues — DAS channel geolocation, Remote Sensing (2025) · DOI: 10.3390/rs17183142
- Dian Chen, Qingwen Liu and Zuyuan He — Journal of Lightwave Technology (2019) · DOI: 10.1109/JLT.2019.2901276



How Can We Help?
Please describe your request and how we can help.